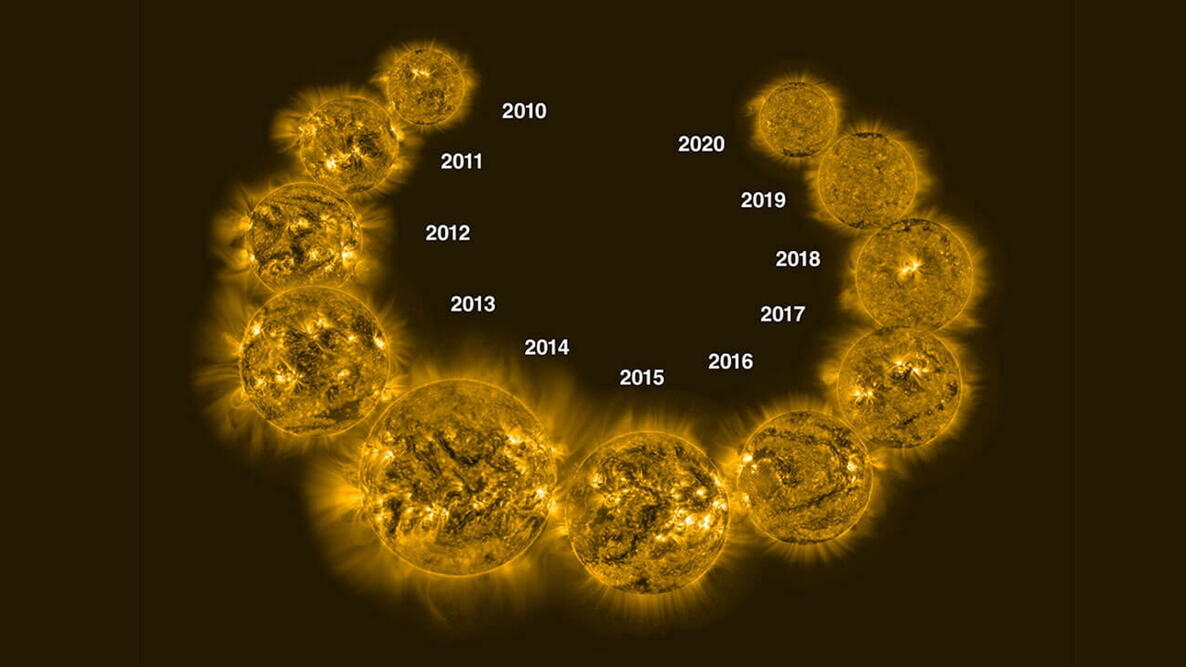
Caption
The solar cycle from 2010 to 2020, viewed from spacecraft.
Our Sun goes through what we call a “solar cycle” roughly every 11 years. During this time, the Sun’s magnetic field completely flips! Learn all about the solar cycle, what causes it, why it lasts this long, and how it affects weather and life on Earth.
What is the Solar Cycle?
A new solar cycle comes roughly every 11 years. Over the course of this cycle, the Sun will transition from a period of low solar activity to stormy, high activity and then back to low activity again.
The solar activity is largely determined by the number and size of sunspots on the surface of the Sun. These are dark areas are associated with greater concentrations of magnetic activity.

When the Sun is mid-cycle and reaches its peak, the Sun’s north and south poles flip! The south magnetic pole switches to north and vice versa. The change in polarity and reversal of the magnetic field has happened, on average, every 11 years over the past centuries.
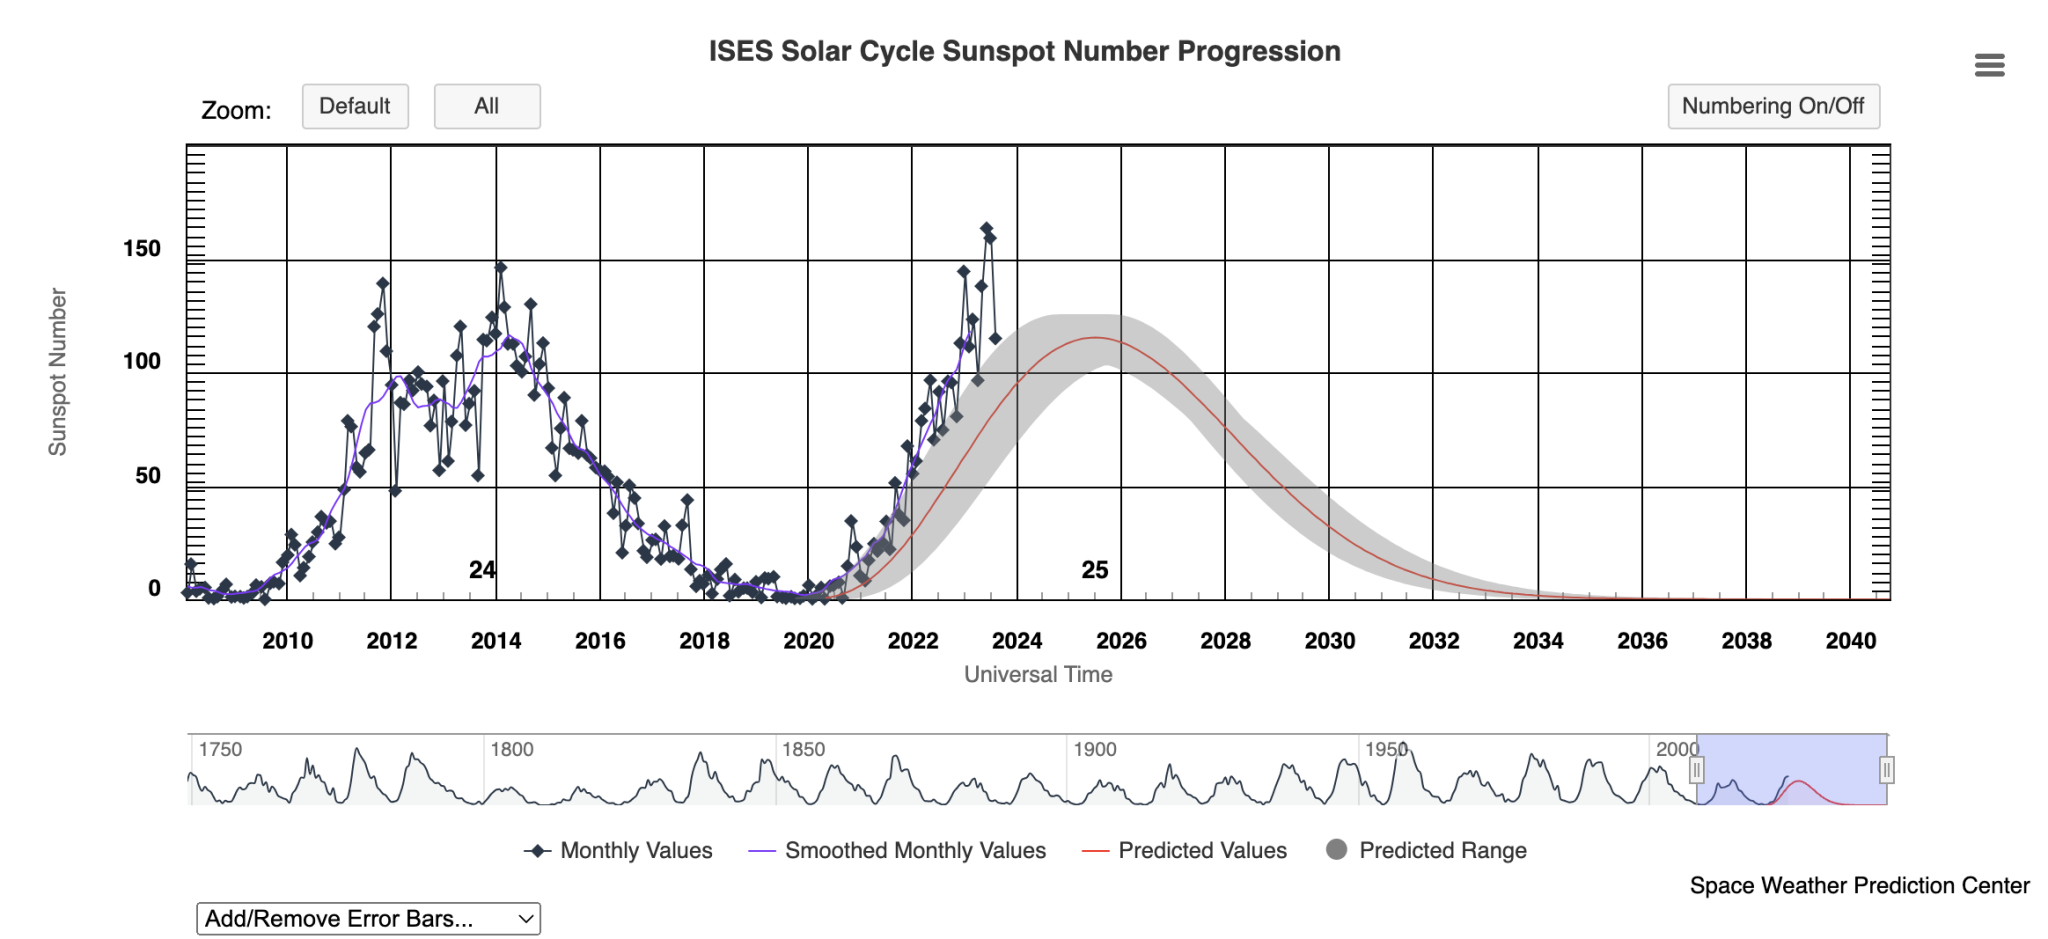
Solar Cycle Sunspot Progression
How Long is a Solar Cycle?
As mentioned above, the average length of a solar cycle is 11 years. However, it has been as short as eight years and as long as 14 years.
- At the beginning of the 11-year cycle, there are no or few sunspots and it’s called the “solar minimum.”
- At mid-cycle, the Sun’s sunspots peak and build to a very active, stormy “solar maximum.” This is when the north and south poles of the Sun flip!
- At the end of the cycle, the solar activity fades and we reach the “solar minimum” again. A new solar cycle begins.

Credits: NASA/SDO
What Causes the Cycle of Solar Activity?
To understand a solar cycle, it’s important to understand the Sun’s behavior. Our star is a glowing ball of electrically-charged gas. The Sun’s high temperatures causes these electrically-charged gases to constantly move around the surface of the Sun.
Similar to Earth, the Sun has a north and a south magnetic pole. Because of the Sun’s magnetic nature, the Sun’s gases constantly gets tangled, stretched, and twisted. Imagine a rubber band that’s getting so stretched, it’s about to snap! This is why the Sun re-organizes its inner magnetic fields and changes polarity at its most dynamic point.
Sunspots, Solar Flares, and CMEs
Solar activity isn’t just sunspots but also solar flares and coronal mass ejections (CMEs). Both tend to occur near sunspot groups when the Sun is more active. Naturally, all of this solar activity coincide with solar maximum. Here are brief definitions:
Sunspots: The black regions on the surface of the Sun are called sunspots; in these areas, magnetic fields are particularly strong. This is indicative of stormy weather on the Sun and a lot of active magnetic activity beneath the surface. More sunspots means more solar activity.
The dark spots are cooler than the surrounding areas. Think of them as caps to a magnetic storm that is brewing just below the solar surface. The Sun’s magnetic fields are moving around, getting twisted and concentrated in these regions. See our article which further explains sunspots.
Solar Flares: Associated with sunspots are flashes of light on the Sun, called solar flares. Occasionally, when powerful magnetic fields reconnect, they explode and break through the Sun’s surface! There is a sudden burst light energy and X-rays.
We classify flares according to their strength. The smallest ones are B-class, followed by C, M, and X, the largest. M-class flares can cause brief radio blackouts at the poles and minor radiation storms that might endanger astronauts.
Coronal mass ejections (CMEs): Sometime the Sun erupts, hurling large pieces of magnetic energy into space at speeds up to several million mph. Other solar events include solar wind streams that come from the coronal holes on the Sun and solar energetic particles that are primarily released by CMEs.
Video: Coronal mass ejection, or CME, traveled away from the sun at over 900 miles per second. Credit: NASA SDO and SOHO.
How Does Solar Activity Affect Earth?
Space weather that affects Earth is not uncommon, which is why scientists track the Sun’s activity just as they might Earth’s weather and climate.
1. Solar storms can affect electrical power grids, satellites, GPS on aircraft, radio communications, and more. As Earth is more dependent on technology, this can be concerning. Large solar flares have the potential to cause billions of dollars in damage to the world’s high-tech infrastructure.
- For example, in January of 2022, massive solar storms destroyed 38 of the 49 Starlink satellites launched by SpaceX.
2. When the Sun is quiet, weak solar wind allows more galactic cosmic rays into the inner solar system. This can cause radiation hazards for astronauts. Even airline pilots and crew can get a higher dose of radiation during solar storms.
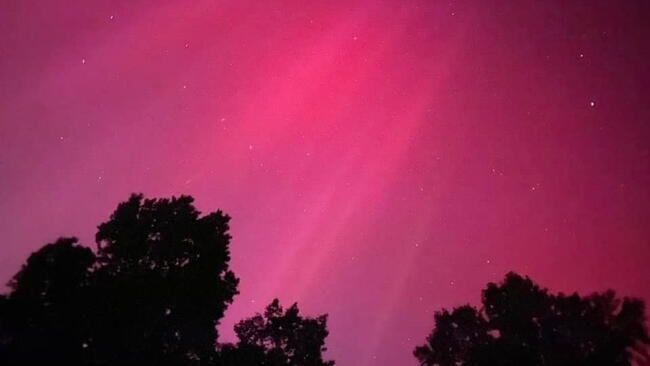
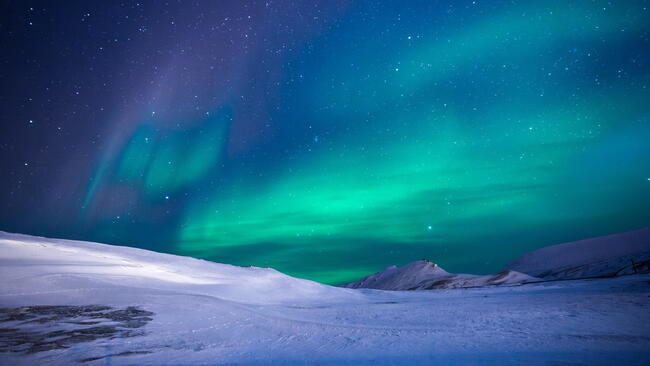
3. On the positive side, big solar eruptions cause the auroras, known as the Northern Lights in our hemisphere. Those gorgeous, shimmering bands of colors happen when the Sun erupts with a coronal mass ejection.
- The energized particles or what we call “solar wind” reach Earth’s magnetic field and interact with the gases in the atmosphere to create dancing colors in the sky.
- Auroras are usually visible in the northern tier U.S. and in Canada, but high solar activity can occasionally cause auroras to reach our southern states!
4. Finally, the Sun’s activity also affects Earth’s climate. History has shown us that long-term periods of global cold, rainfall, drought, and other weather shifts have been influenced by solar cycle activity.
- For example, times of depressed solar activity seem to correspond with times of global cold in history. The most famous example is the “Little Ice Age.”
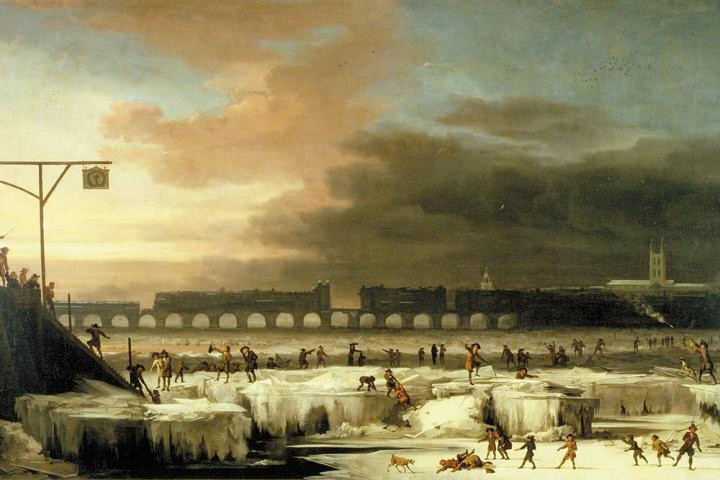
The Maunder Minimum and the “Little Ice Age”
- Between 1645 and 1715—during what we now call the “Maunder Minimum”—sunspots were exceedingly rare.
- Specifically, there were only about 50 sunspots (instead of the usual 40 to 50 thousand) and harsh winters.
- For 70 years, temperatures dropped by 1.8 to 2.7 degrees Fahrenheit.
- Seven decades of freezing weather, corresponding with the coldest period of the Little Ice Age, led to shorter seasons and ultimately food shortages.
Conversely, times of increased solar activity have corresponded with global warming. During the 12th and 13th centuries, the Sun was active, and the European climate was quite mild.
Experts do not know for certain, however, what caused the Little Ice Age; theories suggest that it was likely due to a combination of events. Some scientists are researching other factors, such as heightened volcanic activity, that corresponded with the time of the Maunder Minimum.
What Solar Cycle Are We In Now?
We are currently in Solar Cycle 25, which started in December 2019. Record-keeping of solar cycles began in 1755 with Solar Cycle 1.
Some cycles have maximums with lots of sunspots and activity. Other cycles can have very few sunspots. Cycle 24 was a very quiet cycle which little solar activity.
As the cycles can overlap, it can be challenging to predict when a new solar cycle begins. However, there are some clues.
- For example, sunspots tend to form nearer the Sun’s equator as the cycle winds down (and at higher latitudes when a new cycle begins).
- Scientists measure solar cycles by keeping track of the number of sunspots appearing on the Sun’s surface as well as noting the location.
- A new solar cycle is considered to have begun when sunspots group at higher latitudes with the magnetic polarities of the leading spots opposite that of the previous cycle.
Will Solar Cycle 25 be quiet or wild? See Solar Cycle 25 Predictions.

More Like This
- « Previous
- 1
- 2
- …
- 10
- Next »

Comments