
How Climate "Normals" and "Averages" Are Calculated
Listen to weather predictions, and you’ll notice the terms “normal” or “average” used to describe current conditions. These averages are based on 30 years’ worth of data, and we’ve started a new 30-year period this decade. But what makes a “normal” normal?
A Normal Start
Attempts to set common standards for weather and climate data records cropped up in the early 1870s through the International Meteorological Committee (IMC). For the next 60 years or so, countries simply arithmetically averaged the weather data that they had on record. In 1935, the global meteorological community set three decades as the basis for comparison on the belief that climate conditions were fairly stable and were likely to reoccur every 30 years. Today, the World Meteorological Organization, which evolved from the IMC, continues that practice, updating every 30 years.
In the mid-1950s, the U.S. National Weather Bureau (now Service) adopted the 30-year base but advanced it a decade every 10 years. The thinking was that with decadal advances the calculations stood a better chance of representing current conditions. Many national weather services, including those of Canada and the United Kingdom, use this standard today.
Read Next
2020 marked one bookend of a 30-year period. In 2021, the National Climatic Data Center (NCDC) in Asheville, North Carolina, once again shifted the base data period from 1981–2010 to 1991–2020. This involved sweeping up the period’s daily temperature, precipitation, and other weather information from more than 7,000 climate stations around the country and computing new statistics. NOAA released this new data in May 2021.
Normal No More?
The processing of calculating normals may sound simple enough. But over the last decade, a growing number of people have said that the normals, used as a tool for forecasting conditions months ahead, aren’t working for them anymore.
Arguments over how official calculations are made get aired decade after decade, says Nolan Doesken, former state climatologist for Colorado, and the outcomes of these discussions matter to more than just weather experts. Normals are used to determine how much you pay to heat your home, whether you may face water restrictions this summer, and even when it’s best to plant your vegetables or annuals.
Many weather and climate experts say that the 30-year period—updated each decade—is long enough to average out the effects of natural climate swings, to help meteorologists to smooth out discrepancies in readings, and to place weather and climate activity in a common historical context. But despite the label “normal,” these numbers may not really represent what you could expect to experience today.
Anthony Arguez, a scientist at NCDC who has worked on calculating the base numbers, believes that it’s “a stretch” to presume that the 30-year base formula represents current conditions. Because the calculations for normals are in reality mathematical averages, the results best represent conditions that exist around the midpoint of the base period (e.g., 1985 for the period 1971–2000). Robert Livezey, former chief of the climate-service branch of the U.S. National Weather Service (NWS) and a proponent of greenhouse gas–induced global warming, considers the traditional 30-year base “essentially worthless … as a benchmark for decision-making” in today’s world. “When the convention was decided upon, rapid climate change was not an important consideration,” he says.
Other experts chafe, even scoff, at the use of the word “normal” at all when talking about weather and climate. They cite the formula’s incompatibility with Mother Nature. Chuck Doswell, a former severe-weather scientist at the University of Oklahoma, has argued that since extremes are a feature of weather, the normals would be more useful if they also addressed how often or how frequently weather departs from the average.
Such viewpoints, as well as the increasing demand by energy, agriculture, insurance, investment, and other interests for “normals” that better represent today’s conditions, are leading the NCDC and other agencies to seek additional techniques for calculating normal or average conditions. At last count, a dozen methods, some with highly specialized uses and several involving shorter base periods, have been proposed or are in development.
Expect the grumbling and the traditional calculations to continue. As new methods are added, the 30-year statistics will remain as a reference for research.
“When it’s all said and done,” says Doesken, “for most applications we revert back to those 30-year averages.”
Strengths and Weaknesses of Normal Numbers
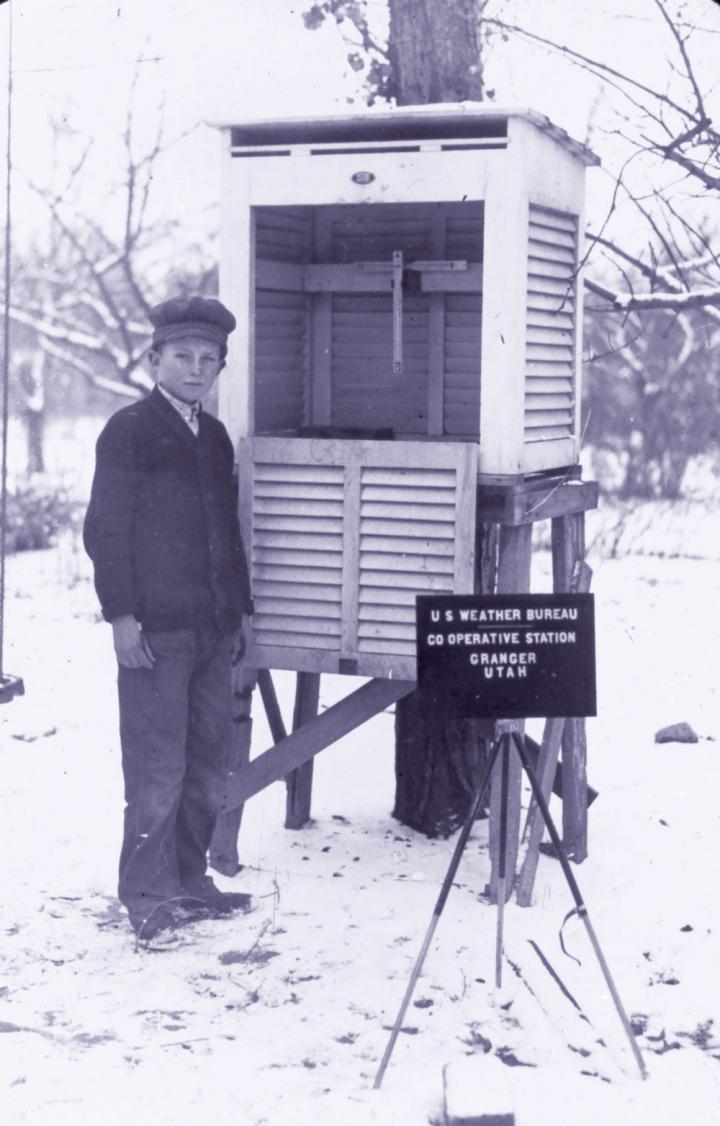
The process of calculating weather statistics starts with collecting data from weather stations. The NCDC has to make sure that the data each station records come from changes in the weather and not from other factors that just look like changes in the weather.
This is especially true for data supplied by volunteer “cooperative” stations. Although rigorous NWS standards apply, volunteers move. They may shift their daily observing times, or they may cease running their stations due to medical or other problems. (In the mid-1990s, the U.S. government replaced many human-tended stations with stations in an automated surface-observing system, or ASOS, to gain uniformity.)
Weather stations also move. For instance, in the early 1960s, Denver authorities built a reservoir in the Rockies, filling a valley that had long hosted a weather station. The state moved the station to its current location along the shore of the reservoir—a move compatible with NWS standards.
“Lo and behold, there was an immediate and significant change in temperature and precipitation,” says Nolan Doesken. Days became cooler, nights were warmer, and precipitation dropped. Among the reasons: The station sat on the sheltered side of a small ridge that blocked snowfall from the north.
Similarly, wildfires, which vastly change vegetation cover, and urban development, which brings pavement and heat-absorbing materials, can introduce changes in the records that do not reflect actual changes in weather patterns or climate trends.
To provide a background of measurements untainted by phenomena such as the urban heat-island effect, the U.S. government established a network of automated “reference stations” around the country in locations far from human encroachment. The U.S. Climate Reference Network is currently made up of 114 stations in the contiguous 48 states, with an additional eleven in Alaska and two in Hawaii.
This article first appeared in the 2010 Old Farmer’s Almanac and has been updated.
Peter J. Spotts


ADVERTISEMENT