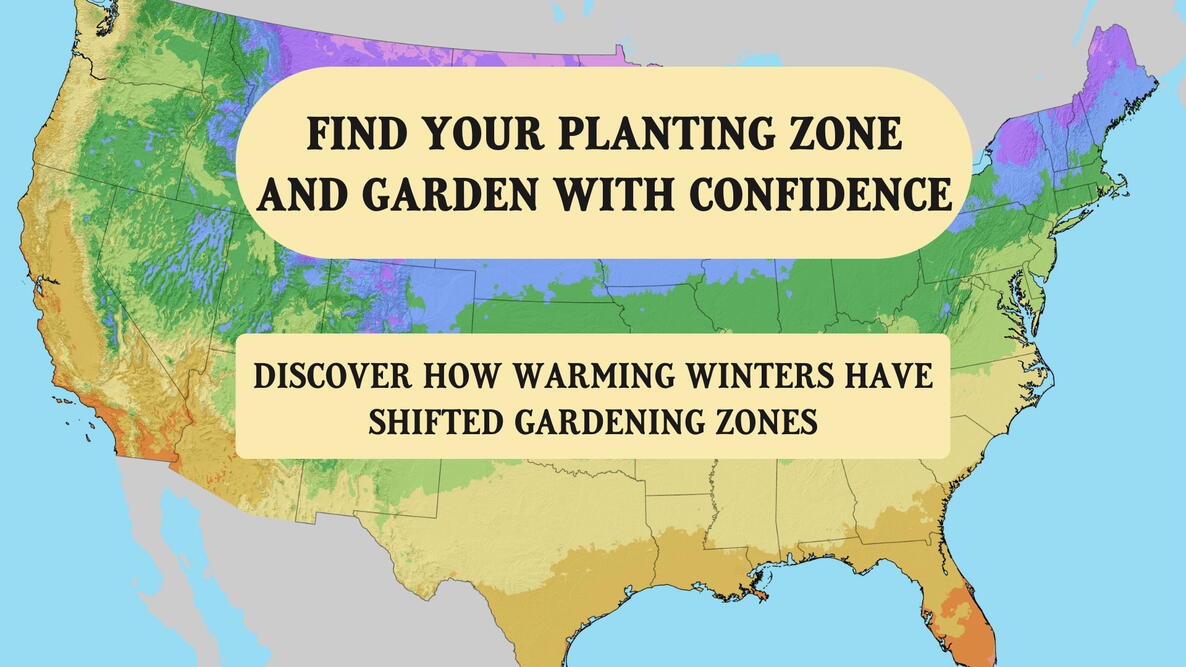
If you’re looking for the latest USDA Plant Hardiness Zone Map, you’ve come to the right place. The useful gardening resource divides the country into 13 zones, with each zone covering a 10°F range of average winter lows.
What does that mean for your garden? Understanding your zone helps you choose plants suited to your local winters. See the USDA zone map, learn what the zones can (and can’t) tell you, and find examples of plants to grow in each one.
See the Official USDA Plant Hardiness Zone Map
The USDA Plant Hardiness Zone Map pictured here was released in 2023 and remains the officially recognized current version.
What planting zone are you in? Use The Old Farmer’s Almanac USDA Zone Lookup Tool to find out.

Readers have mentioned that the legend in the bottom-right corner of the official zone map is hard to see. We agree, so we enlarged it.
Average Annual Minimum Temperature | Zone | Map Color |
|---|---|---|
| -60° to -50°F | 1 | |
| -50° to -40°F | 2 | |
| -40° to -30°F | 3 | |
| -30° to -20°F | 4 | |
| -20° to -10°F | 5 | |
| -10° to 0°F | 6 | |
| 0° to 10°F | 7 | |
| 10° to 20°F | 8 | |
| 20° to 30°F | 9 | |
| 30° to 40°F | 10 | |
| 40° to 50°F | 11 | |
| 50° to 60°F | 12 | |
| 60° to 70°F | 13 |
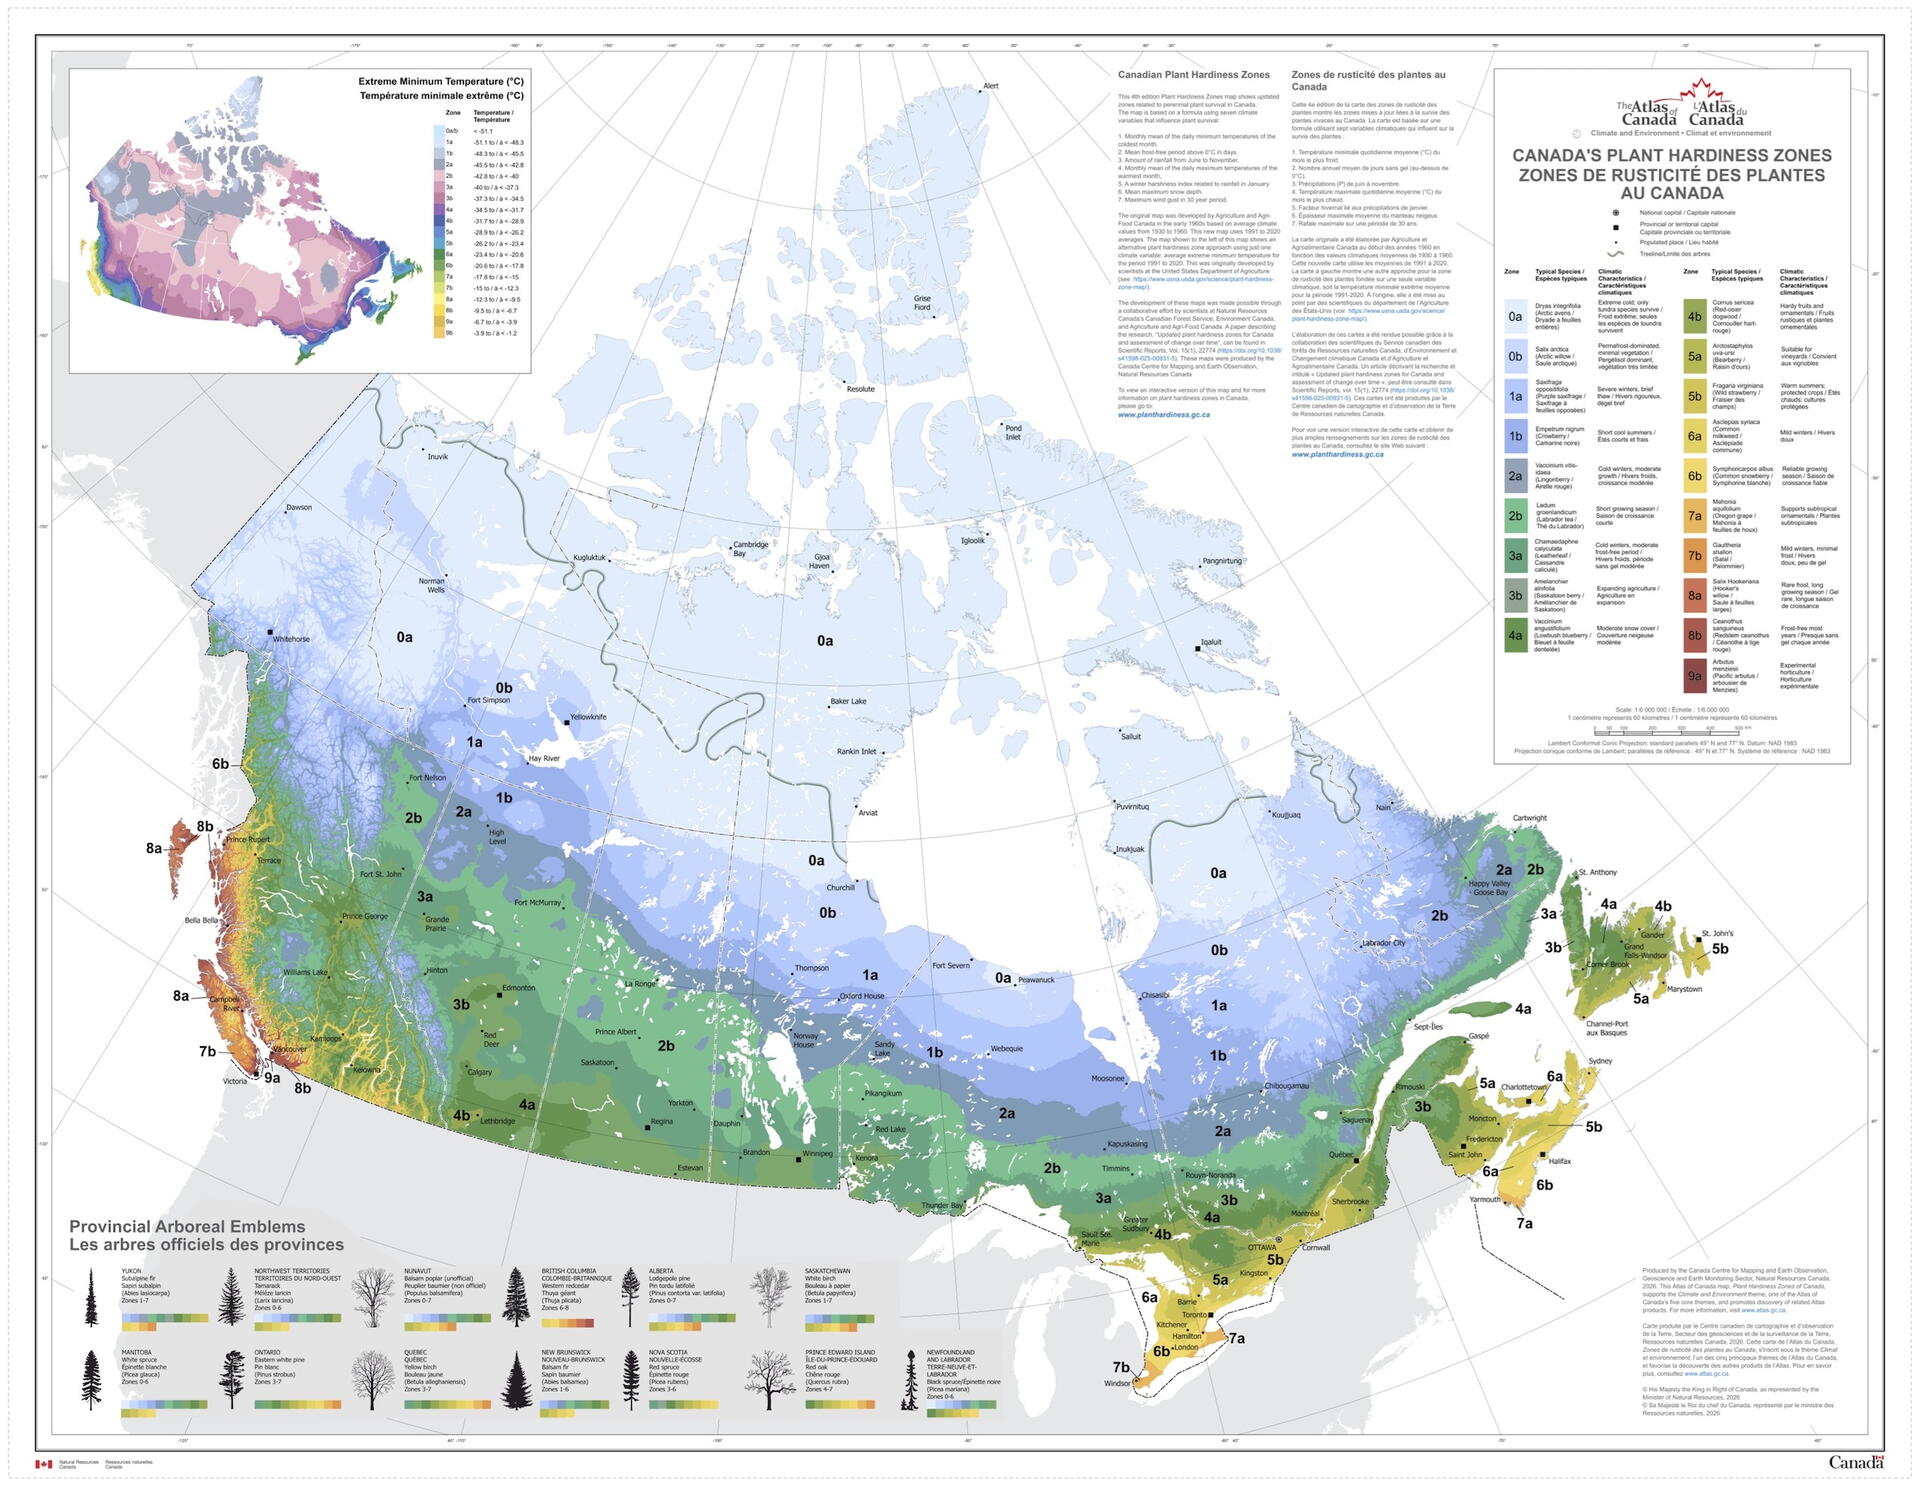
Planting in Canada? Jump to the Canadian Plant Hardiness Zone Map.
Each of the 13 hardiness zones is divided into 5°F half zones (“a” and “b”) so gardeners can narrow down their location even further. For example, zone 7 is divided into 7a and 7b—”a” is the colder half, and “b” is the warmer half.
To explore an exact location, see the USDA’s interactive Plant Hardiness Zone Map. You can also download state, regional, and national maps.
What Are Hardiness Zones?
Plant hardiness zones focus on winter survival for plants based on the average lowest winter temperatures in a region over time (30 years for the 2023 USDA zone map).
They’re the standard gardeners use to determine which plants are most likely to survive winters in a given location. The temperatures are averages, not guarantees—more extreme winters may still occur.
The hardiness zones are most useful when growing perennials, shrubs, and trees, since these plants live beyond one growing season and need to survive winter.
How to Choose Plants for Your Hardiness Zone
Use the USDA zone map to choose plants that are hardy enough for your winters.
Generally, the lower the plant number, the hardier the plants need to be. But hardiness varies by species and variety—when in doubt, check the plant label to make sure you live in one of its recommended zones.
Sample Plants by Hardiness Zone
Zone | Avg Annual Min Temp | Sample Hardy Plants |
|---|---|---|
| 3 | -40° to -30°F | Columbines, delphiniums, peonies |
| 4 | -30° to -20°F | Coneflowers, hellebores, lilacs |
| 5 | -20° to -10°F | Astilbes, bleeding hearts, coral bells |
| 6 | -10° to 0°F | Black-eyed Susans, hydrangeas, sedums |
| 7 | 0° to 10°F | Camellias, crepe myrtles, lavender |
| 8 | 10° to 20°F | Agapanthus, fig trees, gardenias. |
| 9 | 20° to 30°F | Bougainvilleas, cold-hardy citrus varieties, oleanders |
| 10-13 | 30° to 70°F | Bananas, bird of paradise, tropical hibiscus |
Did you know? The Old Farmer’s Almanac lists hardiness zones in all of our Growing Guides!
What USDA Hardiness Zones Don’t Tell You
Hardiness zones should be used as a guide, not a strict rule—there’s a lot they don’t account for that directly affects a plant’s chances of surviving year-round.
- Humidity, rainfall, wind chill, cold snaps, and other environmental factors beyond average winter temperatures. Also, the coldest it’s ever been or will ever be.
- The average number of days above 86°F per year—for information about summer heat, see the American Horticultural Society’s Heat Zone Map.
- Sun exposure, soil type, wind, and other location-specific details that can make a yard—or even just a section of a garden—warmer or cooler than the zone it’s in. These warmer or cooler areas are known as “microclimates.”
- The first and last frost dates—frost dates are important to track when planting annuals (plants that only last one growing season). See The Old Farmer’s Almanac Frost Date Calculator for guidance.
Why Did the USDA Hardiness Zones Change in 2023?
About half of the United States shifted to a warmer half-zone in 2023, a change that the USDA credits to its mapping techniques becoming more advanced over time.
For example, the 2023 zone map uses data from over 13,000 weather stations, and the 2012 map used data from fewer than 8,000.
Planters and growers in the warmer half-zones may be able to grow plants that were once considered unsuitable for their area. However, those plants may still need extra protection during especially cold winters.

Canadian Plant Hardiness Zone Map
Natural Resources Canada (NRC) has a planting zone map for planters and growers in Canada that provides the following information:
- Maximum and minimum temperatures
- Length of the frost-free period
NRC also offers a map similar to the USDA’s that’s based only on extreme minimum temperatures.
Share your zone and favorite plants in the comments below, and connect with other gardeners in your region!
Frequently Asked Questions
-
What is my USDA planting zone?
Use our USDA Zone Lookup Tool to find your planting zone. Zones range from 1 (coldest) to 13 (warmest).
-
Can I grow plants suited for a colder hardiness zone than mine?
Plants hardy to a lower (colder) zone than yours can generally survive your winter temperatures. However, some may struggle with the summer heat or need colder winters to grow and flower well. Check the plant’s label for its full recommended zone range and growing conditions.
-
How often is a new USDA zone map released?
There’s no set schedule for releasing new USDA zone maps. The latest zone map was released in November 2023, 11 years after the 2012 version before it. The last major update prior to 2012 was in 1990.
-
Are the USDA zone map temperatures with or without wind chill?
They are ambient air temperatures only, not adjusted for wind chill. Wind chill affects people and animals (because it changes how quickly heat leaves skin), but it doesn’t change how cold the air actually is. Plants respond to actual air and soil temperatures.
-
Why don't my local conditions match the USDA zone map?
The map shows long-term regional averages, so some areas may be warmer or colder than their zone suggests. If your winters are usually colder, choose plants for a colder zone. The map is updated periodically as new data becomes available.
-
What if I live on the border between two USDA zones?
If you’re on a zone border, your area may experience winters from either zone. To be safe, choose plants hardy to the colder zone. Microclimates—like sheltered spots or open, windy areas—can also make your yard warmer or colder than the map shows.
Sources
- U.S. Department of Agriculture — 2023 USDA Plant Hardiness Zone Map
- U.S. Department of Agriculture — USDA Unveils Updated Plant Hardiness Zone Map

More Like This

Comments